We recently ranked the top 20 fund manager websites in both the United States and Europe in one of our most popular blog posts yet. We used the sites’ fund tools (e.g. fund performance tables and charts) as a one of the benchmarks for judging the overall quality of the site. Amongst other components, most of the fund websites in the list have easy-to-navigate, interactive and branded fund data tools.
Great fund tools, like those of UBS and AXA Group, are just as engaging and interactive as they are informational. We feel strongly that this component should be well designed to attract investors and retain clients. After all, 70% of website traffic on financial sites goes to fund pricing, performance and charting tools.
What does it take for your fund data to rise from the grave? Make charts and tables engaging, customizable, accurate and easy to understand. One way to revive fund data on your website is to implement interactive date ranges in fund charts.
Flexible Date Ranges
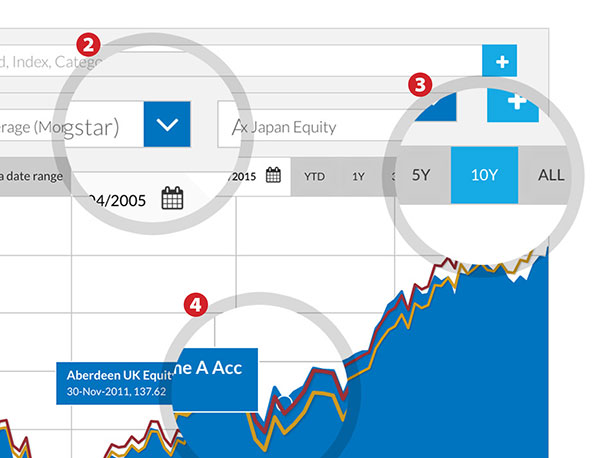
Giving the investor the ability to traverse through time periods of their choice is a subtle, yet powerful way to customize the user experience. Investors can easily traverse through a flexible set of time periods and select custom date ranges going back to the inception of the fund.

There are other ways to create interesting fund data. Download the PDF to discover the four additional areas that can ignite fund data on websites and give clients and future clients what they want.


